KanariesData & analytics
Rath
A visual exploratory-data-analysis tool that recommends charts and insights while supporting manual exploration, data wrangling, and experimental causal analysis.
- Data
- Product
- Data analysis
- Web
- Browser
- Docker supported
- Popularity
- 4.7k Stars
- GitHub stars
- Recent activity
- 8/14/2026
- Maintenance status unclear
- License
- AGPL-3.0
- Strong copyleft
Why it matters
We look beyond stars: what problem it solves, whether it creates real utility, and what makes its approach worth noticing.
Problem
Traditional exploratory data analysis and visualization tools require extensive manual charting and configuration, making the workflow tedious and failing to quickly surface deep patterns and causal relationships.
Practical value
Provides automated chart recommendations, natural language queries, data cleansing, drag-and-drop analysis, and experimental causal analysis features while connecting to multiple mainstream databases and file formats.
Innovation / differentiation
Introduces interactive analysis through data painting alongside an automated augmented analysis engine, combining traditional BI reporting tools with automated exploratory data analysis.
Leverage potential
Supports deployment as an open-source alternative while embedding independent component modules for reuse in other applications alongside mainstream large language model integrations.
Why now
Enters the market as data-driven decision-making gains adoption alongside widespread interest in large language models and automated exploration tools.
Community activity
In the last 90 days there were 0 new issues and 2 pull requests; the bounded issue/PR samples include 0 issue authors and 1 PR contributors, with 0 releases.
Maintainer responsiveness
The 0-issue window sample had a — close rate, and the 2-pull-request sample had a 100% merge rate. Maintainer-comment observations covered only — of that issue sample, so response rate and first-response speed are not reported.
Key highlights
- Use AutoPilot to explore data and generate multidimensional visualization suggestions
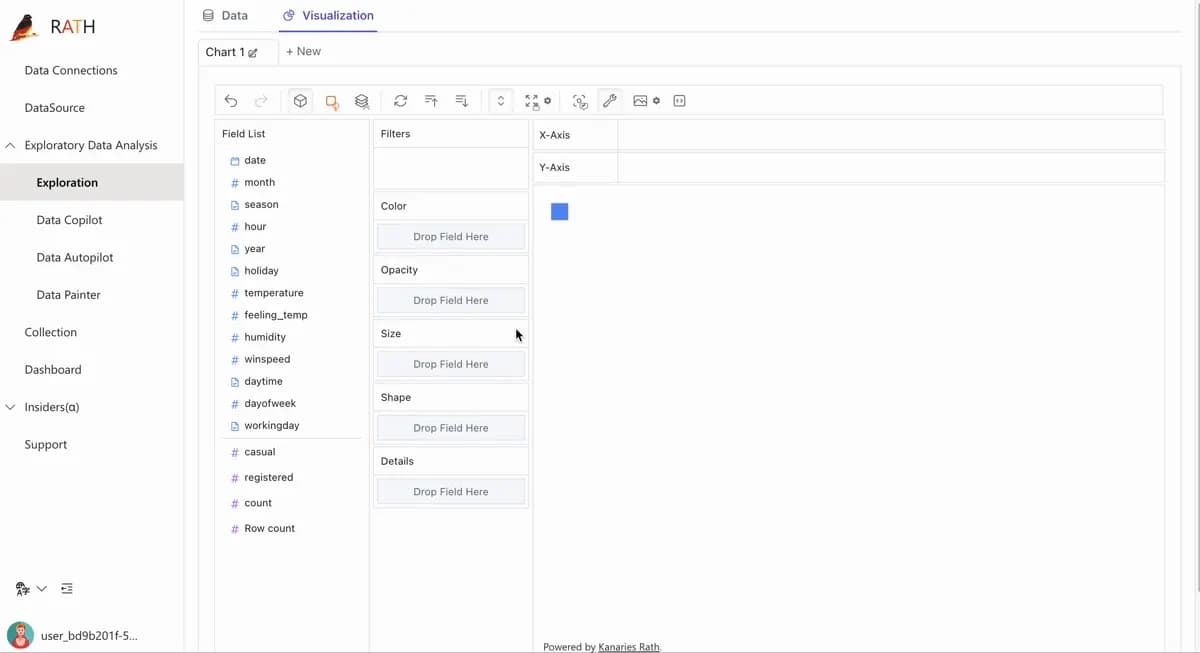
- Explore manually with drag-and-drop controls, AutoVis, and Data Painter
- Prepare data, build dashboards, and ask questions about datasets in natural language
Quick start
How it is installed, how hard it is, and where to start.
Where it runs
Cloud / hosted
Difficulty
Easy — follow the steps
- 01Open the RATH online sandbox first to try the currently exposed data-exploration features.
- 02Import a CSV or JSON file, or connect a supported data source.
- 03Use AutoPilot for automated exploration or drag fields in the manual interface to build visualizations.
- 04Add Data Painter, data-wrangling, or the Alpha causal-analysis features when needed.
Best for
- People who prefer Docker deploys
More about it
RATH is an open-source exploratory data analysis and visualization tool from Kanaries. It can import CSV, JSON, or database data, use AutoPilot to generate exploratory findings and multidimensional visualizations, or let users choose fields and charts manually through a drag-and-drop interface.
Beyond automated chart recommendations, RATH includes Data Wrangler, Data Painter, dashboards, natural-language queries, and a causal-analysis module. The README labels causal analysis as Alpha and describes the project itself as open alpha, so these experimental areas should not be treated as having the stability of a mature BI product.
RATH is licensed under AGPL and provides an online sandbox for trying part of the product. The README points to a separate Kanaries product for additional AI features; those are not part of RATH itself.
Sources
Each field shows its status and source — expand to review.
13 · Expand
Sources
Each field shows its status and source — expand to review.
capability tags
Verifieddata_analysis
Source: manual_curated · Manually curated from the verified project README; no AI draft. · 8/17/2026
editor note
Verified{"en":"RATH is better suited to the “what is in this dataset?” stage than to fixed operational reporting: automated recommendations, drag-and-drop exploration, and Data Painter all center on EDA. It remains open alpha, and causal analysis in particular should be treated as experimental.","zh":"RATH 更适合“先看看数据里有什么”这一阶段:自动推荐、拖拽探索和 Data Painter 都围绕 EDA,而不是固定报表。当前仍是 open alpha,尤其因果分析需要按实验功能看待。"}
Source: manual_curated · Manually curated from the verified project README; no AI draft. · 8/17/2026
how to use
Verified{"steps":[{"en":"Open the RATH online sandbox first to try the currently exposed data-exploration features.","zh":"先打开 RATH 在线 Sandbox,体验当前公开的部分数据探索能力。"},{"en":"Import a CSV or JSON file, or connect a supported data source.","zh":"导入 CSV/JSON 文件或连接支持的数据源。"},{"en":"Use AutoPilot for automated exploration or drag fields in the manual interface to build visualizations.","zh":"使用 AutoPilot 获取自动探索结果,或在手动界面拖拽字段生成可视化。"},{"en":"Add Data Painter, data-wrangling, or the Alpha causal-analysis features when needed.","zh":"需要时再尝试 Data Painter、数据整理和 Alpha 阶段的因果分析。"}],"installAt":"cloud","difficulty":"easy"}
Source: manual_curated · Manually curated from the verified project README; no AI draft. · 8/17/2026
intro
Verified{"en":"RATH is an open-source exploratory data analysis and visualization tool from Kanaries. It can import CSV, JSON, or database data, use AutoPilot to generate exploratory findings and multidimensional visualizations, or let users choose fields and charts manually through a drag-and-drop interface.\n\nBeyond automated chart recommendations, RATH includes Data Wrangler, Data Painter, dashboards, natural-language queries, and a causal-analysis module. The README labels causal analysis as Alpha and describes the project itself as open alpha, so these experimental areas should not be treated as having the stability of a mature BI product.\n\nRATH is licensed under AGPL and provides an online sandbox for trying part of the product. The README points to a separate Kanaries product for additional AI features; those are not part of RATH itself.","zh":"RATH 是 Kanaries 开发的开源探索性数据分析与可视化工具。它可以从 CSV、JSON 或数据库载入数据,通过 AutoPilot 自动生成数据探索结果和多维可视化,也可以使用拖拽式界面手动选择字段和图表。\n\n除了自动图表推荐,RATH 还提供 Data Wrangler、Data Painter、Dashboard、自然语言查询和因果分析模块。README 将因果分析标注为 Alpha,项目整体开发状态也写明为 open alpha,因此这些实验功能不应按成熟 BI 产品的稳定性预期使用。\n\nRATH 采用 AGPL 许可证,并提供在线 Sandbox 用于体验部分能力。需要更多 AI 功能时,README 另行推荐其团队的其他产品,但这不属于 RATH 本体。"}
Source: manual_curated · Manually curated from the verified project README; no AI draft. · 8/17/2026
Latest release
Verified2.1.0
Source: GitHub API · latest_release=2.1.0 · 10/2/2026
License
VerifiedAGPL-3.0
Source: GitHub API · license.spdx_id=AGPL-3.0 · 10/2/2026
needs api key
VerifiedNo
Source: manual_curated · Manually curated from the verified project README; no AI draft. · 8/17/2026
One-liner
Verified{"en":"A visual exploratory-data-analysis tool that recommends charts and insights while supporting manual exploration, data wrangling, and experimental causal analysis.","zh":"面向探索性数据分析的可视化工具,可自动推荐图表和数据洞察,并支持手动拖拽分析、数据整理与因果分析实验功能。"}
Source: manual_curated · Manually curated from the verified project README; no AI draft. · 8/17/2026
Platforms
Verifiedbrowser
Source: manual_curated · Manually curated from the verified project README; no AI draft. · 8/17/2026
Category hint
Inferred from materialsai-apps
Source: Project README · hint=ai-apps · 8/15/2026
product forms
Verifiedweb
Source: manual_curated · Manually curated from the verified project README; no AI draft. · 8/17/2026
role tags
Verifieddata, product
Source: manual_curated · Manually curated from the verified project README; no AI draft. · 8/17/2026
supports docker
VerifiedYes
Source: Repository file · dockerfile=true; compose=true · 10/2/2026
Related projects
Other verified projects matched by category, capabilities, and intended roles.
clearml
A machine-learning development and MLOps platform for experiment tracking, remote orchestration, data versioning, and model workflows with hosted or self-hosted servers.
liam
A tool that generates interactive ER diagrams from existing database schemas through public-repository links or a CLI workflow for private repositories.
Apache DevLake
An engineering data platform that unifies sources such as GitHub, GitLab, Jira, Jenkins, and SonarQube for DORA and delivery analytics in Grafana.
rill
A code-first business intelligence platform that uses SQL and YAML to define metrics and provides data access interfaces for AI agents.
duck-ui
An open-source, browser-based DuckDB workbench featuring a SQL editor, notebooks, charts, and local AI assistance.
Dishylink
Open-source Starlink monitor for macOS, Windows, and browsers using the local dish API.